[/vc_column_text][vc_empty_space][vc_column_text]Google Data Studio is a new Google tool to visualize data and to create reports in no time. The purpose of this tool is to create simple reports, that you can share, customize them and to perfom a visual analysis of the data so that it’s easier and faster to obtain results.[/vc_column_text][vc_empty_space height=”20px”][vc_single_image image=”7626″ img_size=”full” alignment=”center” image_hovers=”false”][vc_empty_space height=”20px”][vc_column_text]Google Data Studio includes data connectors from all main Google tools (Google Analytics, Google Adwords, Google Sheets, DoubleClick, Big Query …) so that it is very easy to import the data you need for your reports.[/vc_column_text][vc_empty_space height=”20px”][vc_column_text]
More Information
[/vc_column_text][vc_empty_space height=”20px”][vc_column_text]You can learn more about the new features and functionalities in the Google Data Studio release notes.[/vc_column_text][vc_empty_space height=”20px”][vc_video link=”https://www.youtube.com/watch?v=6FTUpceqWnc&t=7s” align=”center”][/vc_column][/vc_row]
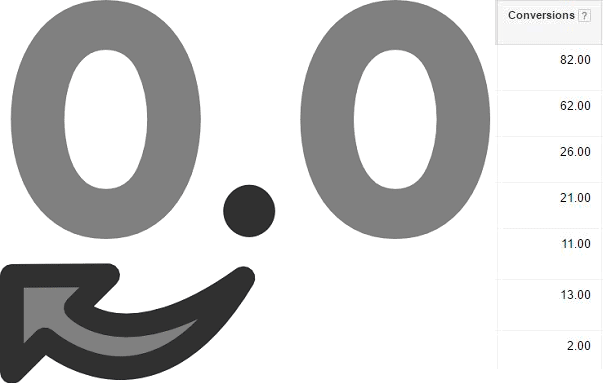
You might have realized that conversion data: "Conversions", "All conversions" and "Cross-device conversions" are all displayed with two decimals (while it used to be integers)